Neve Gordon
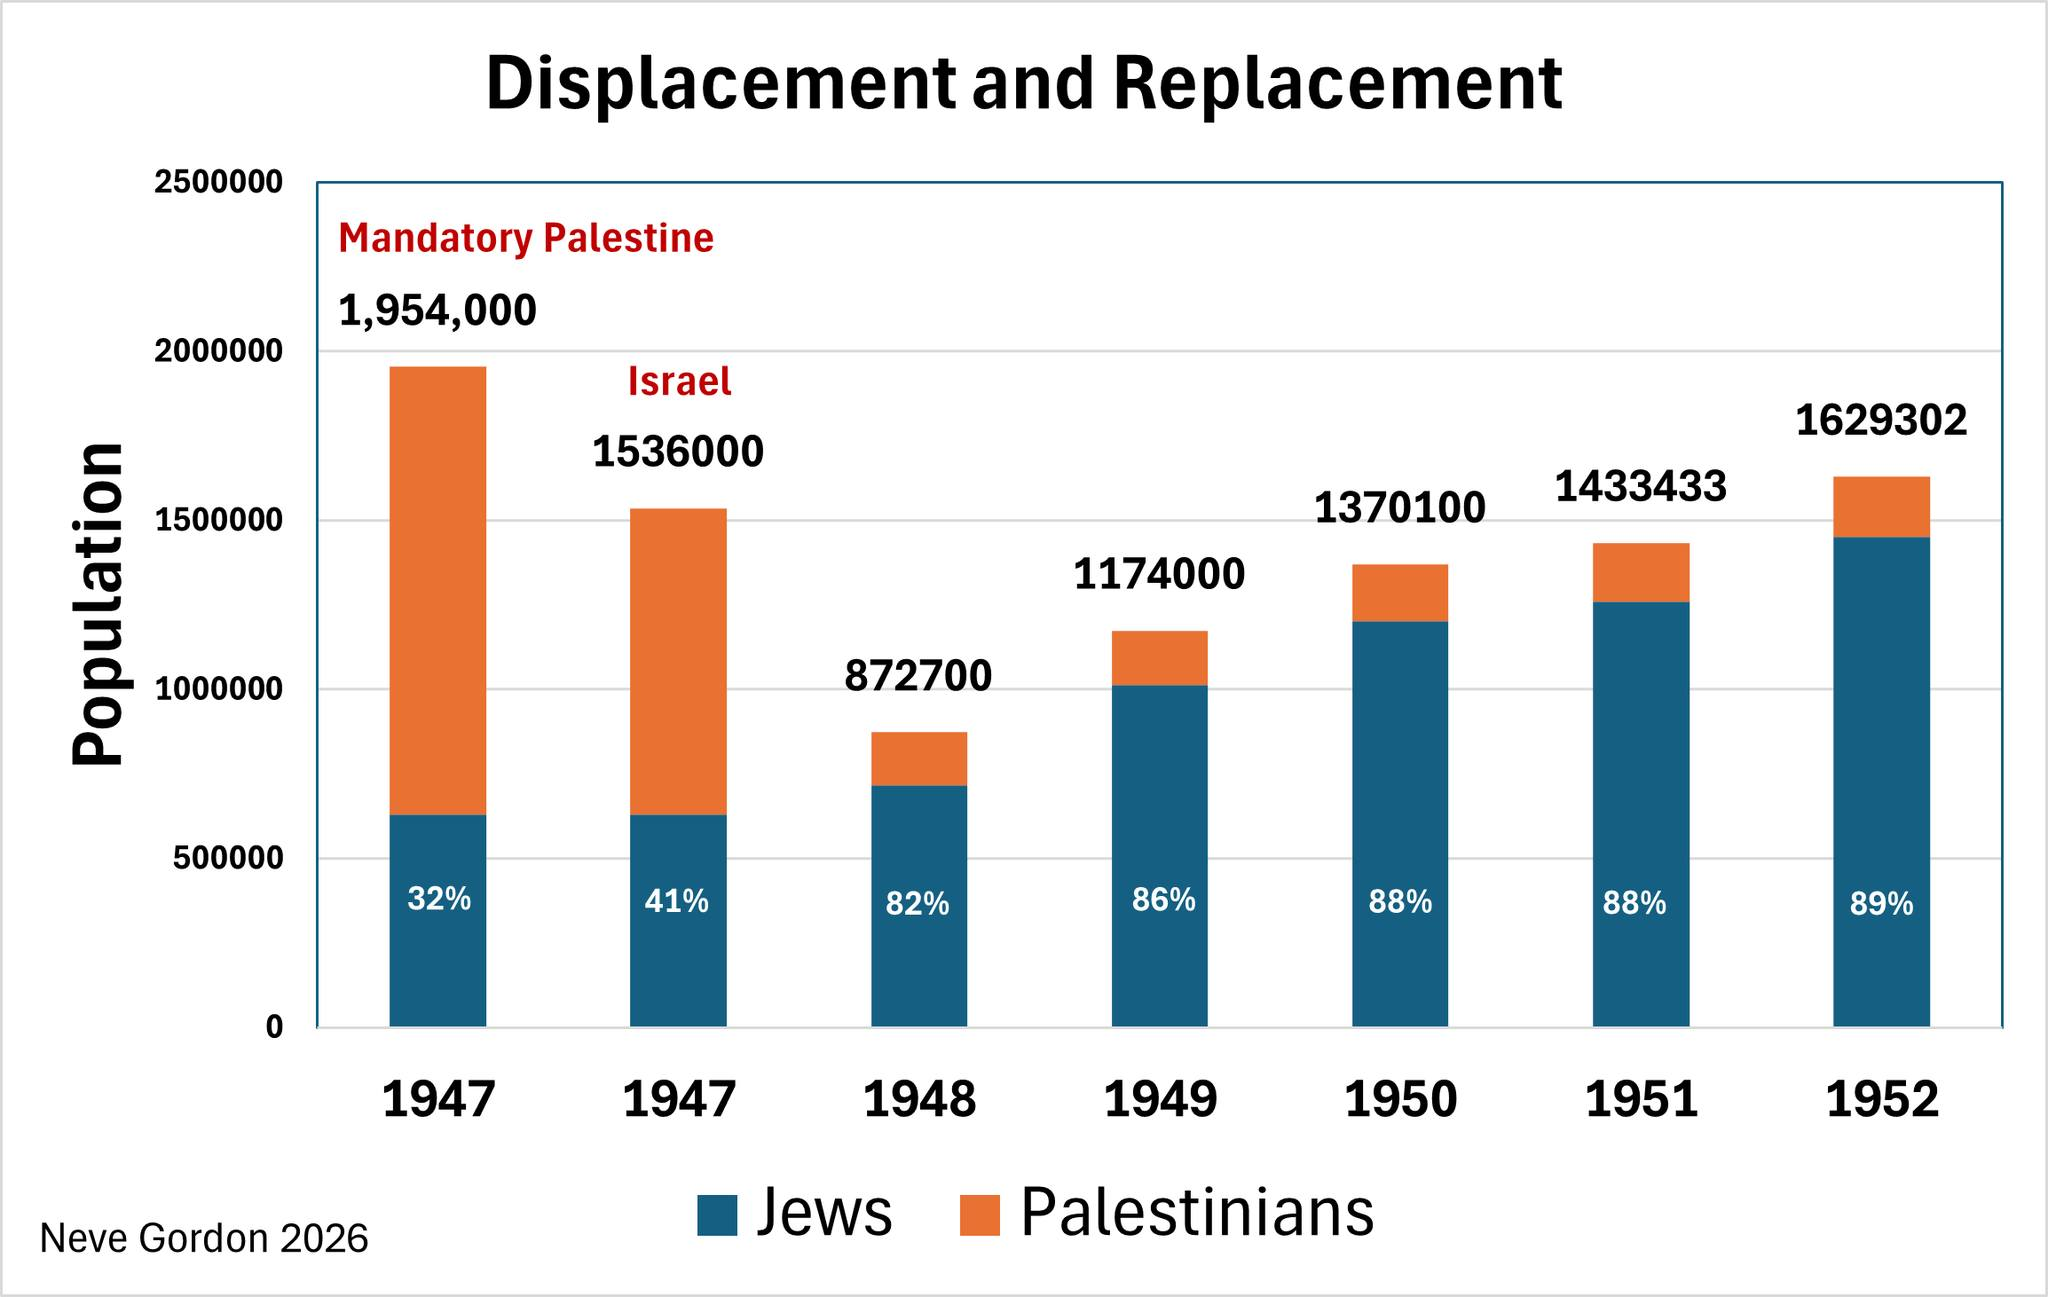
In preparation for my talk at the University of Waterloo Canada I re-examined the data about the population in mandatory Palestine and Israel from 1947 to 1952. What we see in the graph below is the changes in the make up of the population over a period of six years. The size of population in 1947 mandatory Palestine was about 1.95 million. At the time, Jews comprised 32% of the population. The size of the population in 1947 in what would become Israel (namely, without the West Bank and Gaza Strip) was slightly above 1.5 million and in 1947 the Jews comprised 41% in that area. Within four and a half years the 750,000 Palestinians who were expelled or fled and became refugees in 1948 were replaced by a similar number of Jews, and the total population in Israel had reached the size it had been before the war. Obviously, the proportions had shifted dramatically from 59% Palestinians in 1947 to 12% in 1951. This is a graph that depicts the settler colonial logic of displacement and replacement, whereby the settler first displaces and then replaces the native.